A common question that people ask is ‘does the analysis from the Isovist_App correlate with or match to the same kinds of analysis that DepthMapX produces?’. The following case study takes a quick look at that, providing direct comparisons between results produced by the Isovist_App and those achieved through DepthMapX. The plan used to generate such results is a version of the Space Syntax ‘Gallery Plan’, which is commonly used as a test scenario.
To establish as close a degree of parity as possible, the two analysis sets were produced on the same MacBook Pro (Retina, 15-inch, Mid 2015); 2.8 GHz Intel Core i7; 16 GB 1600 MHz DDR3; AMD Radeon R9 M370X 2 GB. Two measures were compared; Isovist_2.0 connectivity against DepthMapX connectivity, and Isovist_2.0 Mean Visual Depth against DepthMapX Visual Mean Depth.
The key comparison statistics for the runtime of the two analyses are provided in the following table.
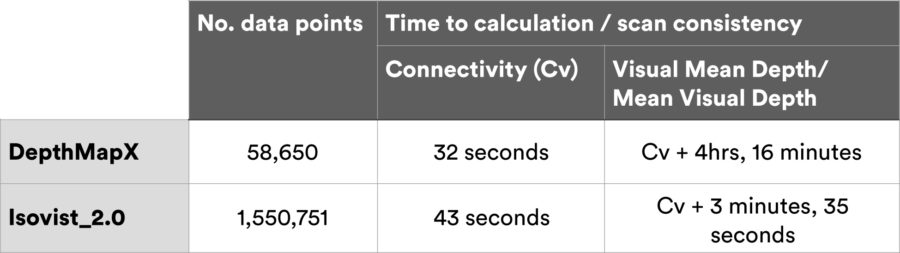
The Isovist_App is here operating at a factor of circa 25 times the data resolution of DepthMapX; it completes that larger amount of calculations in 1/60th the time.
The above isovist scan calculation times relate to an analysis run of 50 global sample cycles (circa 6,250 local sample cycles). During this particular run, the device operated at an average of 24 cycles per second; a more powerful desktop machine would accelerate such a rate further.
But, does it correlate?
Firstly; here is a visual comparison of the Isovist_App connectivity scan to the DepthMapX connectivity map.
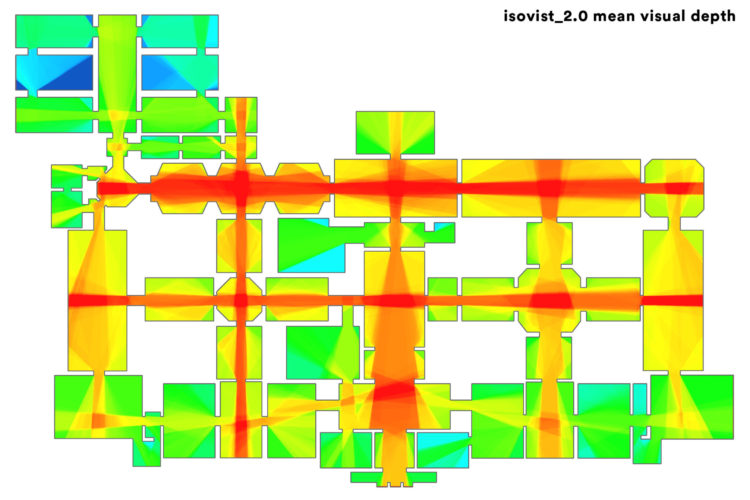
Secondly; here is a visual comparison of the Isovist_App Mean Visual Depth scan to the DepthMapX Visual Mean Depth map.
A clear visual match between result sets can be observed. Moving from DepthMapX to Isovist_App feels akin to drawing back a veil to get a clearer view of space.
But, does it correlate?
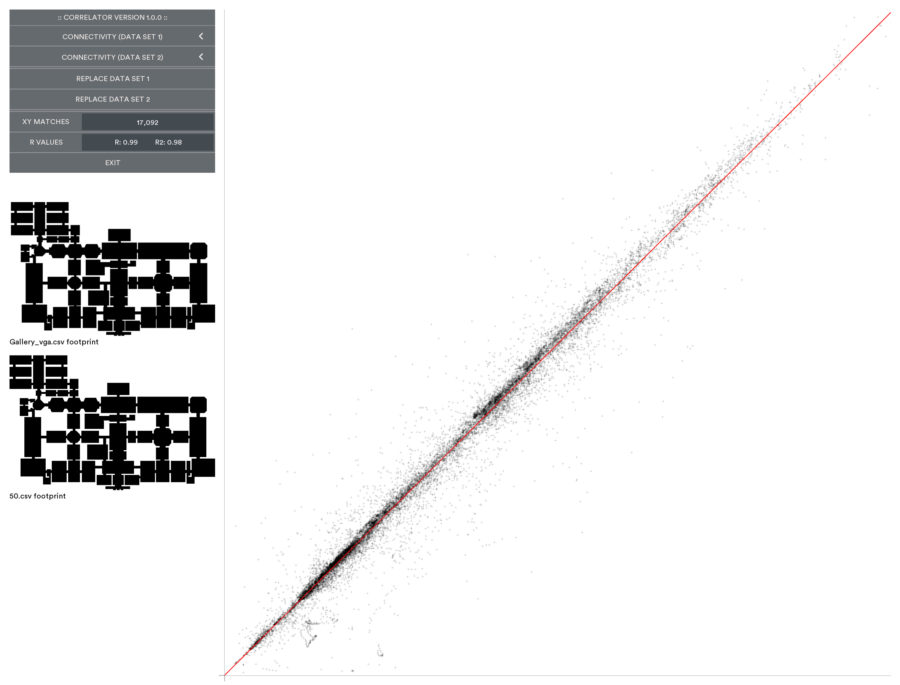
In order to statistically compare the two data sets’ varying numbers of points, a bespoke correlator programme was written. It searches the data sets and finds relative co-ordinate matches for correlation purposes.
Comparing Isovist_App Connectivity to DepthMapX Connectivity gives an R value of 0.99 (Rsq = 0.98):
Comparing Isovist_App Mean Visual Depth to DepthMapX Visual Mean Depth gives an R value of 0.95 (Rsq = 0.90):
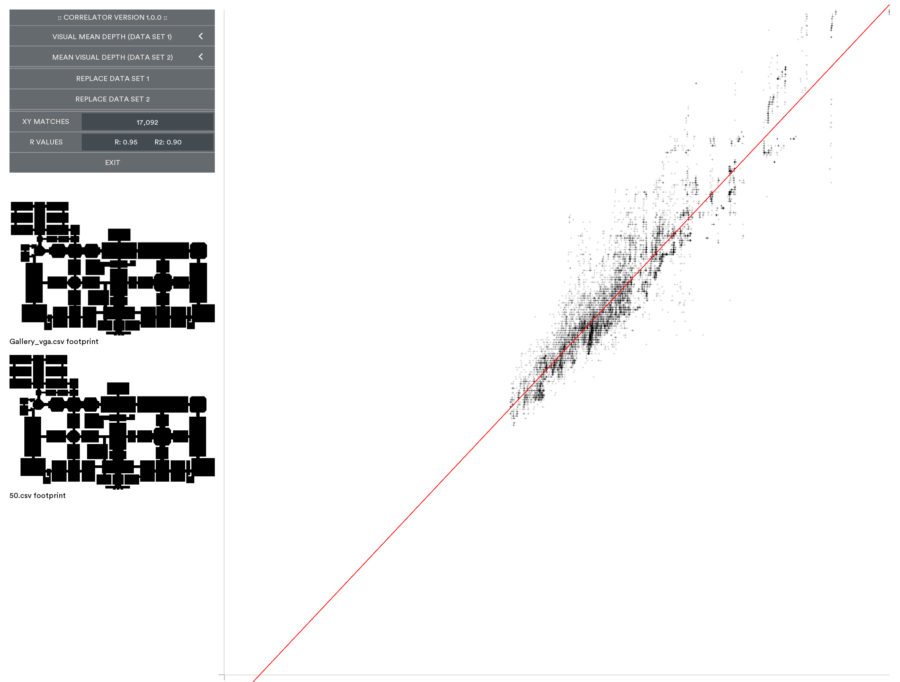
The above appear to be stable correlations that do not significantly change with any further global or local sampling cycles of the Isovist_App calculations. A future case study will examine the degree of change in the analysis as the global cycles progress.
One thought to “Does it correlate?”
Hello, I am Anita. I am a researcher and my guide has told me to explore this software. I am finding it very user-friendly. I am referring user guide. In 3.2.6 Field Analysis, I am finding only Area, Vista length, Agarage radial, and No field options but in the manual video, I could see many options such as Perimeter, Compactness, Occlusivity, Drift, Skewness, etc. Could you please help me to locate these options?
Thanks and Regards