This blog is written by Jack Harding, a former UCA student, who wrote his Third Year undergraduate thesis in part using the isovist software.
I always find the opening sentence a bit awkward, but never mind, it’s done now! I’m Jack and I graduated from Canterbury School of Architecture in 2018. Since then, I have gone on to spend two years in practice; I started my masters in September 2020 and am now enjoying avoiding nine-to-five work for another two years (global pandemic not withstanding!). From a young age I always thought I wanted to pursue architecture as a career (that or race car driving). That was until I began architecture and started to question whether it was exactly what I thought it was, but then again I don’t like to leave things unfinished.
I have always had an interest in the way the places we call our homes make us feel and in simple terms that was what I saw architecture as when I decided to pursue it; creating spaces people can turn into their homes. In the home the ability to be familiar with your immediate surroundings is in overdrive. You know where every utensil is kept in the kitchen, you know which stairs or floorboards creak when stepped on, you know exactly where to turn the shower dial to every morning so it is a comfortable temperature.
Having recently moved into a new flat learning all the micro details of my new home is an exciting time. The first week of chaos as you try to get the heating to work, and realise it take over two minutes for the kitchen tap to run hot, and that the door needs to be slammed in a certain way for it to lock is a very immersive time as you and your new home acclimatise to each other and work out your differences. Being in lockdown for the last few months has made this a particularly intense experience too!
The Thesis Investigation
For my undergraduate thesis I wanted to examine these intuitive maps and memories we all have, perhaps subconsciously, of our homes. I decided to take a closer look at key works of the well-known home creator Frank Lloyd Wright and pay particular focus to three case studies that track the course of his career: the Robie, Storer and Gordon houses.
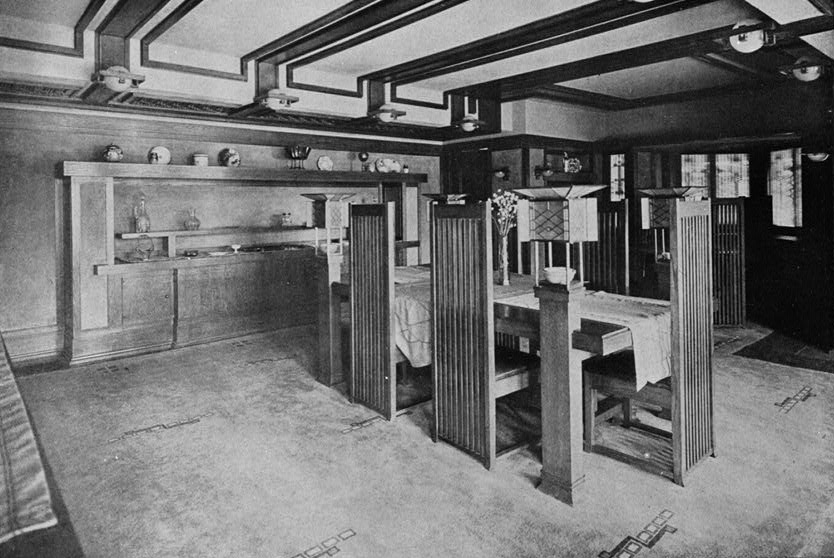
Fig. 1: Interior of the Robie House in 1911; Photocopy of Plate #115, Frank Lloyd Wright, Ausgefuherte Baute, Berlin: Ernst Wasmuth A-G, 1911
It is commonly discussed that Wright believed that the most crucial space in any house was the hearth, saying, “The hearth is the psychological centre of the home”. I wanted to be able to re-examine this statement and test the validity of it quantitatively. I hoped to be able to review such quantitative testing alongside contemporary qualitative writings on the subject, and photographic evidence of occupation, to examine whether Lloyd Wright’s house typologies configuratively match his polemical statements. The Isovist software allowed me to take non quantifiable statements, identify relevant measures, and then ascertain numerical data to be analysed and discussed.
Initially I sought to define the most important word in Wright’s statement; centre. Centrality was key to my analysis and so, my first step was to consider which isovistic measure would be most relevant to model such a quality, and so be best applied to the plans of the buildings selected. Several definitions of centrality were available. I particularly liked centrality defined as a measure of how many connections one node has to other nodes within a space. With this definition the immediate follow up question is, which spaces within a plan warrant a node? Nodes can be taken as rooms defined by actual physical boundaries (bedroom, bathroom), spatial regions within an open plan (dining area, living area), or spaces with prescribed functions (work desk, dinner table).
Other definitions of centrality were also reviewed. I considered figurative centrality, shape informational centrality and visibility centrality to see if any of them particularly aligned to a demonstrable isovistic measure. I settled on working with two broad ranging, widely accepted, definitions of centrality. The first being the quality or fact of being in the middle of somewhere or something; the second being the quality of being essential or of the greatest importance. The initial perception of these two definitions is that the former is quantifiable through geometric analysis, whilst the latter is more of a qualitative explanation, based on perceived importance. However, the isovist software allowed me to test both of these definitions through a variety of measures and produce directly comparable data.

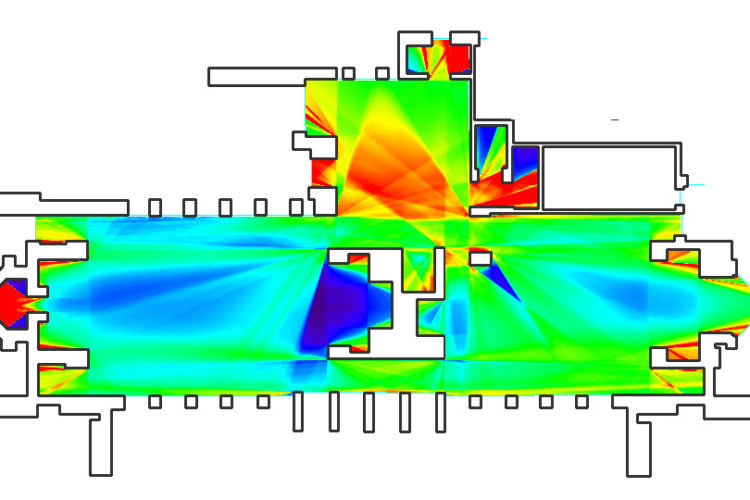
Fig. 2: Hearth arrangement at the John Storer House
I began my plan analysis by ‘exploring’ the selected homes with point isovists to gain an understanding of where the hearth was first seen from upon entering the building. Doing so allowed me to ascertain if its centrality was linked to it being immediately apparent, thereby acting as an attractor to lead a person towards it. I then went on to specifically examine the fields generated by mapping the local measures of connectivity, drift and occlusivity and the global measure of mean visual depth throughout the plan spaces. All of these measures allowed me to explore my hypothesis from different points of view and produce a range of evidence which could further be cross referenced with qualitative writings to form an overall argument.
Generating Isovist Fields
To describe my analytical use of the isovist software and how it aided my spatial research, it is useful to use the ‘Connectivity’ measure as an example. Connectivity is a stochastically calculated local metric (this essentially means ‘randomly sampled’ – but it is how you will start defining things after a few weeks of research in the subject). It can be simply defined as the measure of the amount of space immediately connecting a space of origin, or the visible area of that space. After selecting this metric for your desired plan, (in my case the Robie, Storer & Gordon houses), the results are plotted as a heat map known as a connectivity field.
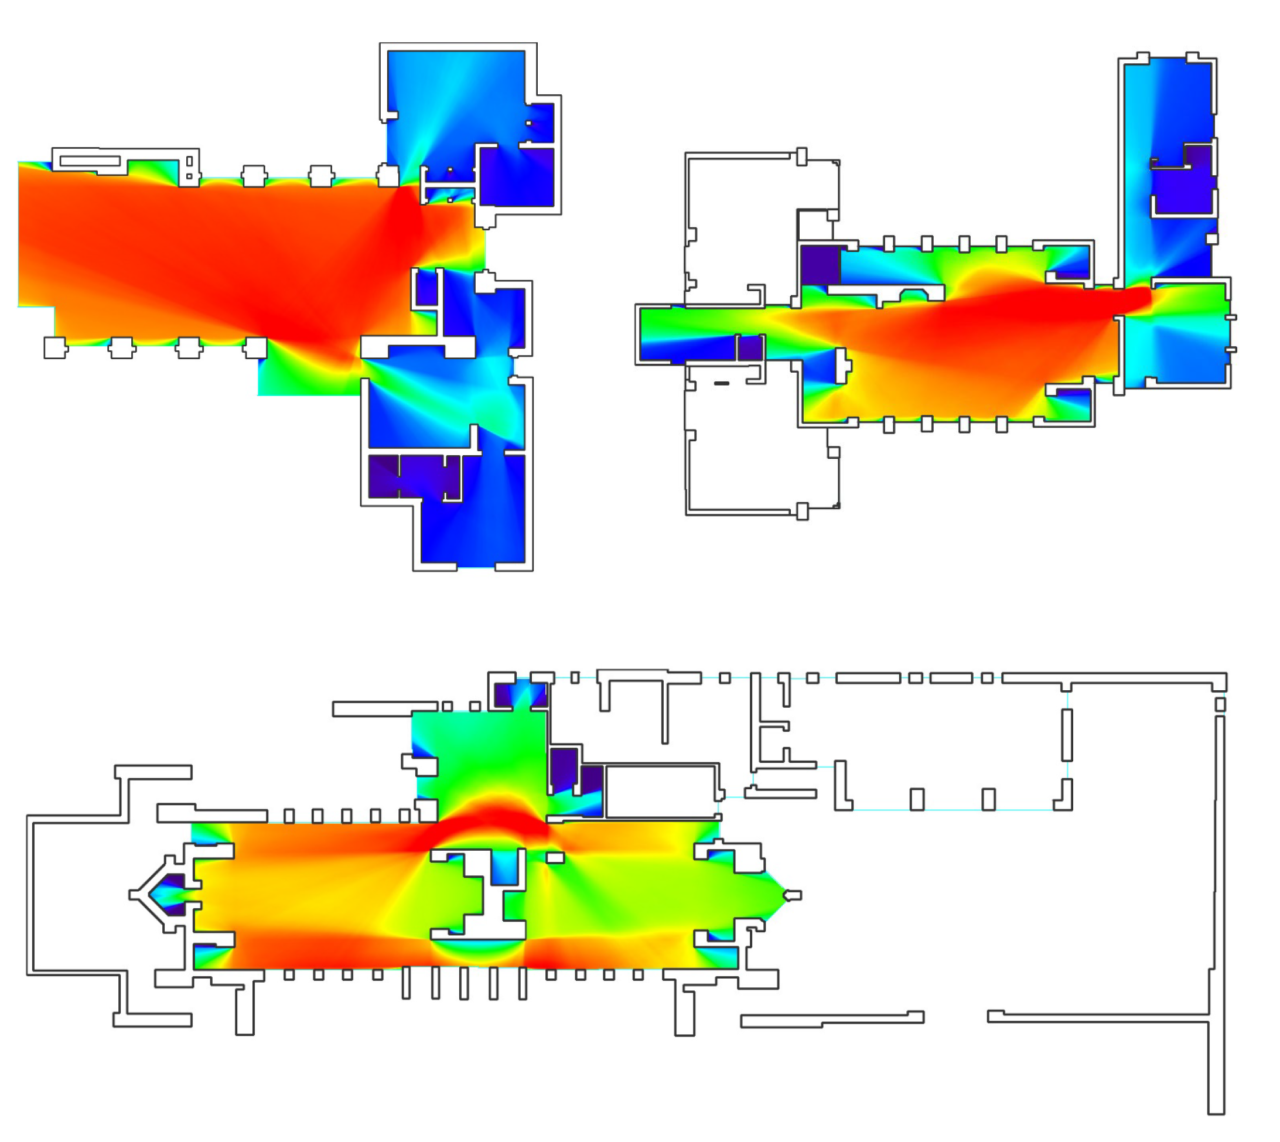
Fig. 3 Gordon, Storer & Robie Houses/Connectivity Fields/Ground Floor
The ‘hotter’ (red) areas indicate the largest, most connected spaces, whilst darker areas would be smaller and less connected. I then set out my hypothesis that the most important space would be where the hearth is to be found, and therefore the ‘hottest’ area of the connectivity field. I was able to analyse each of my case study houses individually, looking at where the areas of peak connectivity sat in the plan and where the levels were at their weakest in the space.
All three plans showed high levels of connectivity in the spaces the hearths were located; especially in the case of the Robie and Storer houses but less so in the Gordon house. I went on to run the other measures of drift, occlusivity and mean visual depth in order to compare results between the field types. All of these interpretations of numerical data were further compared to existing qualitative research, such as user experience and social commentary, before forming my conclusion to the piece.I was able to conclude that my research conducted on three homes by Frank Lloyd Wright, chosen to be representative of three of his distinct building styles, through his career, did go some way to prove his statement that, “The hearth is the psychological centre of the home”.
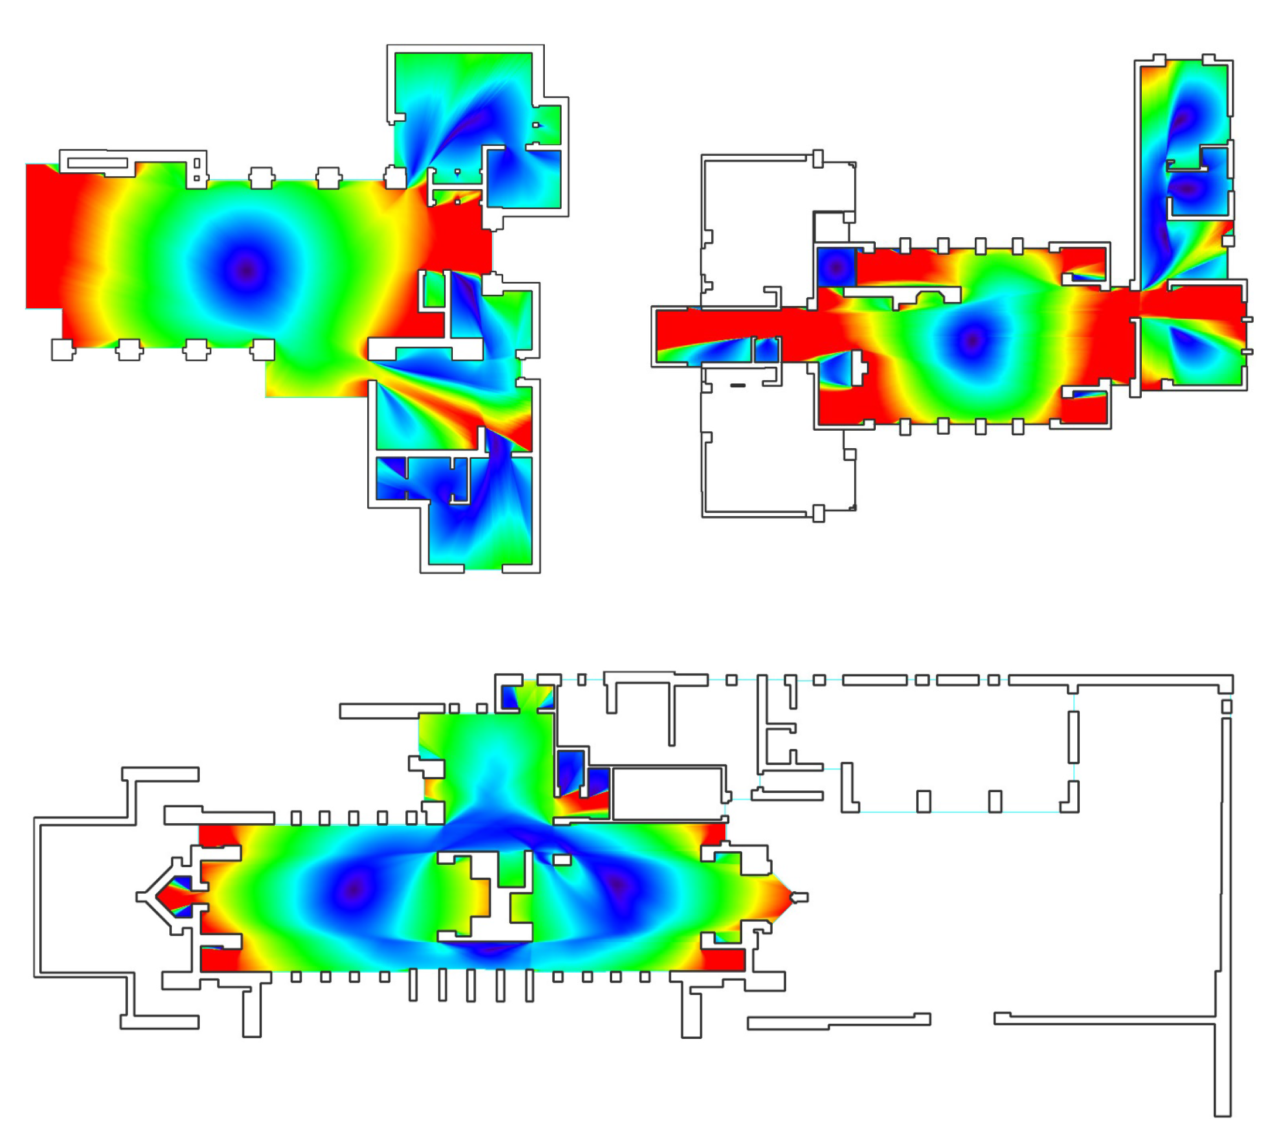
Fig. 4 Gordon, Storer & Robie Houses/Drift Fields/Ground Floor
The use of justified graphs, isovists and isovist fields to apply metrics and be able to generate tangible data to support a perceptual and intuitive statement on design proved to be in the most part successful. Cross examining the data against opinions and reviews by those who have actually experienced the spaces deepened and strengthened my methodologies and supported the results that I found. I concluded that the hearth, whilst not always in direct proximity to the geometric/actual centre of the home, created its own figurative/symbolic centre due both to its configurative prominence and to its figurative grandeur. Overall, it can be said that Frank Lloyd Wright designed all his domestic homes, especially the three analysed throughout, with the hearth in the forefront of his mind to be a place of gathering, connections, and social interaction, where the ideals and values of family life were achieved
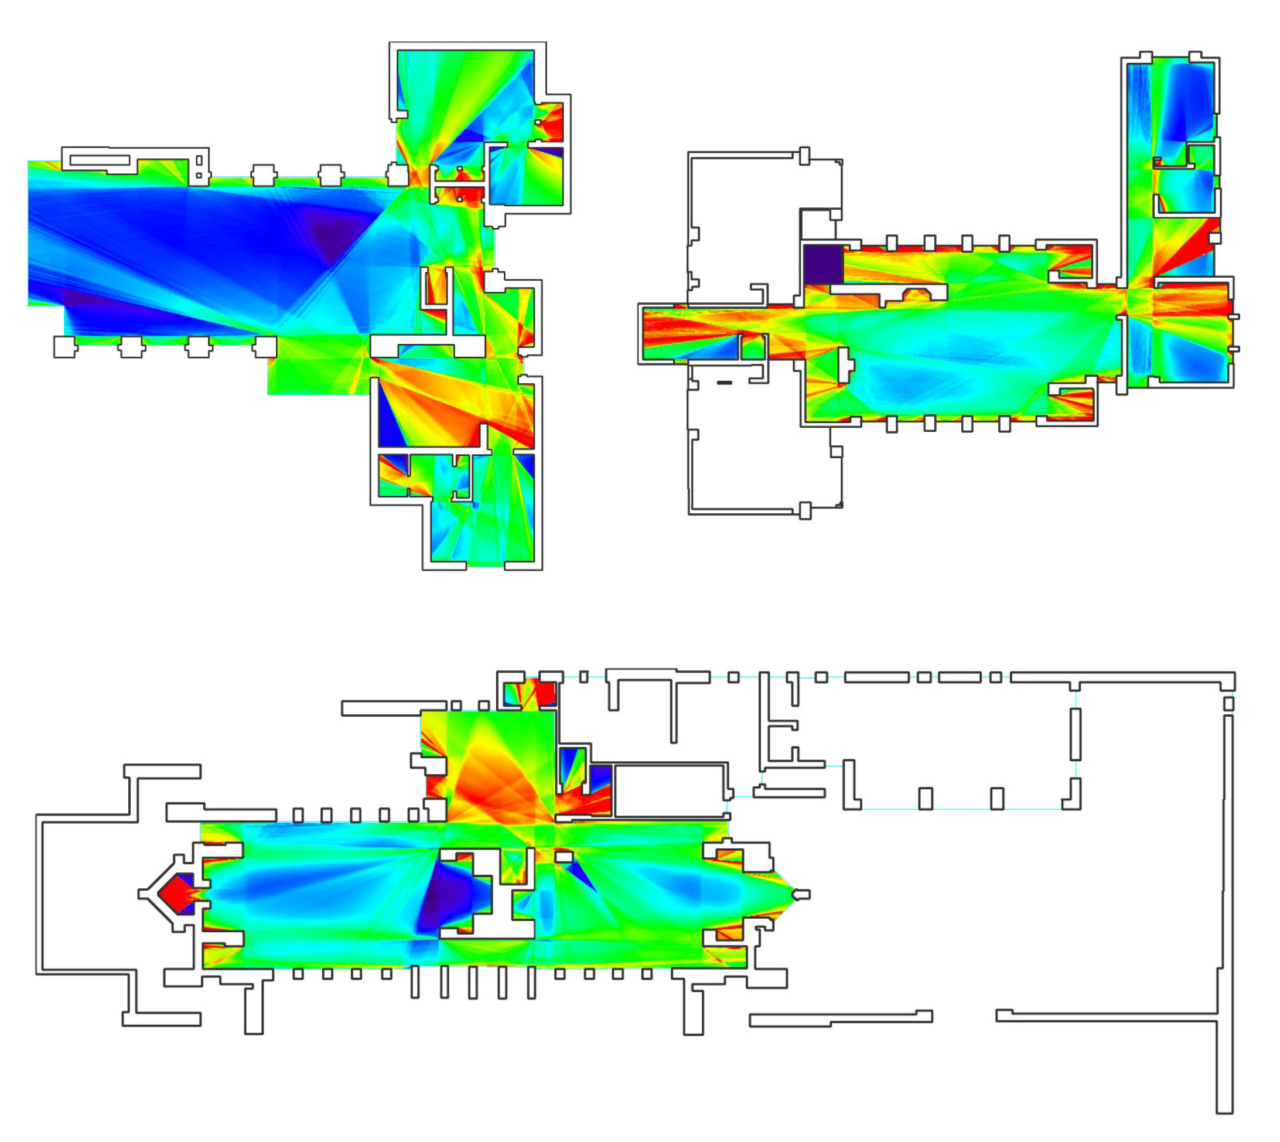
Fig. 5 Gordon, Storer & Robie Houses/Occlusivity Fields/Ground Floor
Mastering the Software
Getting to grips with the world of spatial analysis, and ‘space syntax’ takes time and commitment. For many undergraduate students, including myself, you are stepping into a completely unknown field and attempting to analyse a question using measures you had previously never even considered existed. A lot of reading into the research field was required before embarking on using the actual software in order to arm yourself with sufficient knowledge to interpret the results the software gave. Whilst the scans do immediately look visually attractive and behave in a very cool, aesthetically pleasing way to look at and play around with, in order to actually write a coherent argument you need to think really carefully about what it is you want to measure or examine with them. This means that you have got to be able to interpret and speculate about the fields that you produce; applying your own understanding of what they are trying to tell you through their blue blobs of drift or intensely fading bright reds to light blues of connectivity. I enjoyed the learning and before long felt I could quite cohesively conceive thoughts about space that I sort of always felt I had intuitively. Now they were being synthesised into understandable, testable statements.
The software itself also took some getting to grips with. Preparing plans was an important first step. From then on, after some test runs, the process of writing the thesis came quite naturally and each section followed a rhythm. I would initially begin by defining the metric I was going to use, then go on to make a hypothesis on the possible result in relation to my thesis question and present/analyse the results gained, before subsequently cross checking; by comparing and contrasting the results with the rest of the measures. It was especially important to widen my methodologies to broaden how I tested my hypotheses. I cross referenced my field results with justified graph analysis and qualitative measures such as social commentary and user experience to avoid any incorrect interpretations.
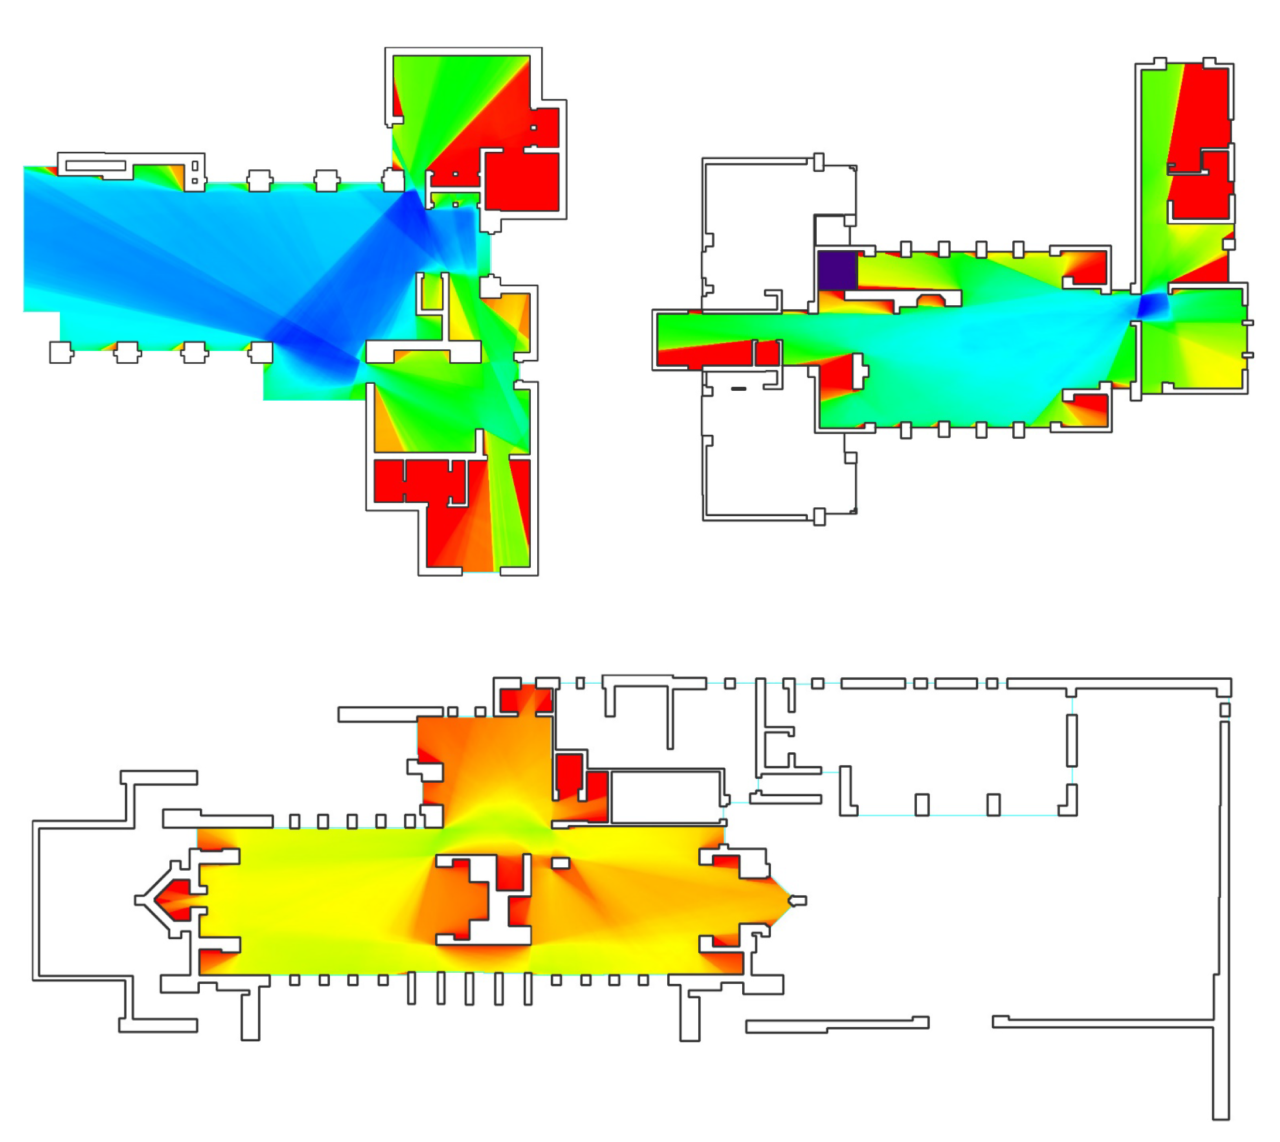
Fig. 6 Gordon, Storer & Robie Houses/Mean Visual Depth Fields/Ground Floor
Due to the topic of spatial analysis and ‘space syntax’ being relatively niche compared to thesis themes that my fellow students chose, (such as sustainable design) I had to spend a lot of time getting familiar with the field; especially reviewing existing research by others. I found one of the most interesting and exciting aspects of the isovist software was the fact of how new it was. It was very rewarding to be generating my own first-hand results and evidence to use in proving or disproving ideas of space. I also definitely believed that my piece of writing provided a modest contribution to the wider field, and how its methods can be used to provide quantitative measures of intuitive phenomena. I will be eager going forward into my masters to explore the isovist software further in both my design and research.
One thought to “Hearth ‘Centrality’”
Hiya,
Thank you for sharing Jack’s experience with the isovist tool. I’m interested in reading his entire thesis as it sounds fascinating!