
Our next guest is Greg Maya, who Sam has been talking to about all things isovist for some time. In 2019 he was awarded British Council Fellowship to explore the works of Rogelio Salmona in Colombia. Here he tells us about his use of the Isovist app at the heart of a series of high profile workshops during his residency in the country….
It all happened under the ROGELIO SALMONA FELLOWSHIP, a three year program from the British Council that aimed at disseminating the works of Rogelio Salmona (in the UK) as well as bringing innovative approaches to his well-researched works to Colombia. I was selected for its third (and last) edition in which I had the opportunity to visit stakeholders, building sites and universities for an in-depth understanding of what made Salmona’s compositions an essential case study for Latin American post-modern architecture. The fellowship was not the first time I had experienced Salmona’s meticulous compositions, and as I described in this blogpost, part of what excited me about the program was having the freedom to develop some on-site workshops. In these, and through the use of the Isovist app, I was able to bring to life some of the hidden characteristics of the buildings and interact with a wide audience. The experience of this is what I’m going to focus on in this blog; but if you feel like digging deeper into my residency you can read this other travelogue or contact me over Twitter. I’m always happy to develop possible collaborations.
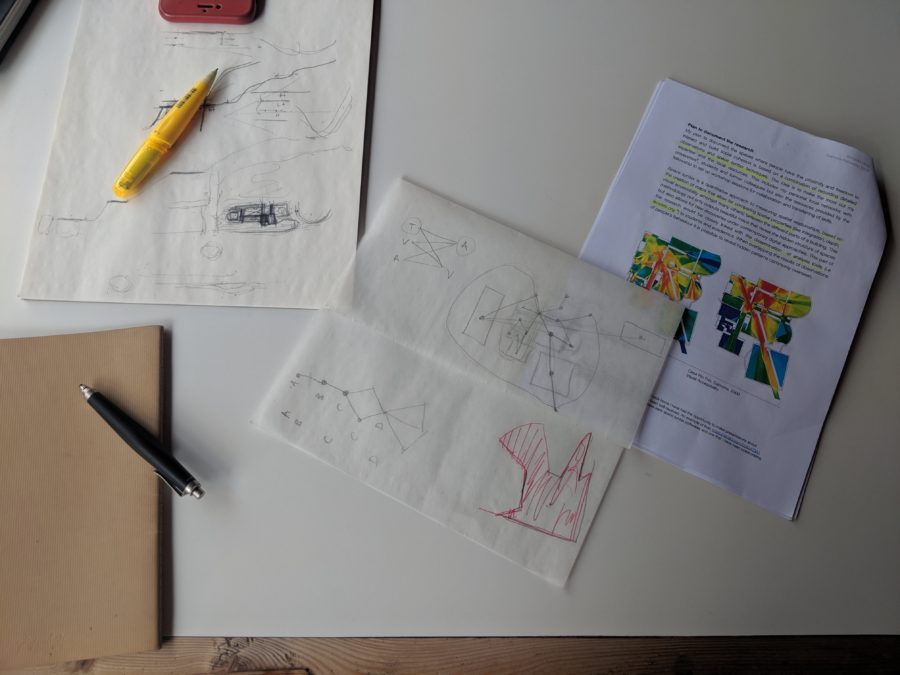
Figure 1: Greg’s early analytic sketches [Photo : Greg Maya]
Why the Isovist app? Why Syntax?
Most probably, if you are reading this you already know some of the benefits of analysing spatial layouts with a method based on network theories (such as Space Syntax). However, not very many of the stakeholders that I met in Colombia had ever heard about it. So, given that I have focused my last 5 years studying and researching about this, I thought I would be in a good place to introduce this approach to some locals. I had to start by convincing the selection panel, though. They seemed happy with my idea of combining the expertise of local professors in Architecture and social sciences with some of my technical background to investigate a potential link between the current post-conflict era in Colombia and Salmona’s physical platforms for social integration and encounter. This was a very ambitious topic and early on I knew that concrete outcomes would be difficult to reach in the time available. Instead, one of my primary aims was to develop enough analytical content to keep everyone on their toes, and update the dialogue; most of the buildings in question being over 10 years old (if not 20 or 30!). On the other hand, I had to be able to produce visually engaging outcomes to keep the audience engaged and interested. These challenges meant that it was clearly the time to use the Isovist app. It’s fast, accurate and much more user friendly than any of its predecessors, and produces beautiful high resolution images… plus I had been using it and talking with Sam McElhinney for a few years.
The audience
In order to turn this personal research exercise into a bit more of an opportunity for others to learn, I had to create content that would attract people from different backgrounds and levels. I wanted to be able to create a space where a discussion could be sparked regardless of the audience’s level of industry expertise, or knowledge of Salmona’s work. This meant, I had to be able to cater for university professors, undergraduate students and even curious minds from other fields. I tried to make my plans as open and inclusive as possible so that anyone could sign up. Fortunately, people from a wide set of backgrounds participated (including a craftswomen who was simply fascinated by the buildings) and my approach seemed to create interesting interdisciplinary discussions. Ultimately, these workshops were an opportunity for the audience to learn some basic elements about systemic thinking, using Salmona’s local case studies. This is where the intuitive and rapid qualities of the Isovist app were very powerful in creating an audience engagement. For me, the exercise became about listening to the audience’s diverse perspectives, and suggestions, before trying to dig deeper into those issues with my methodologies. They were my audience but I certainly learnt a lot from them too.
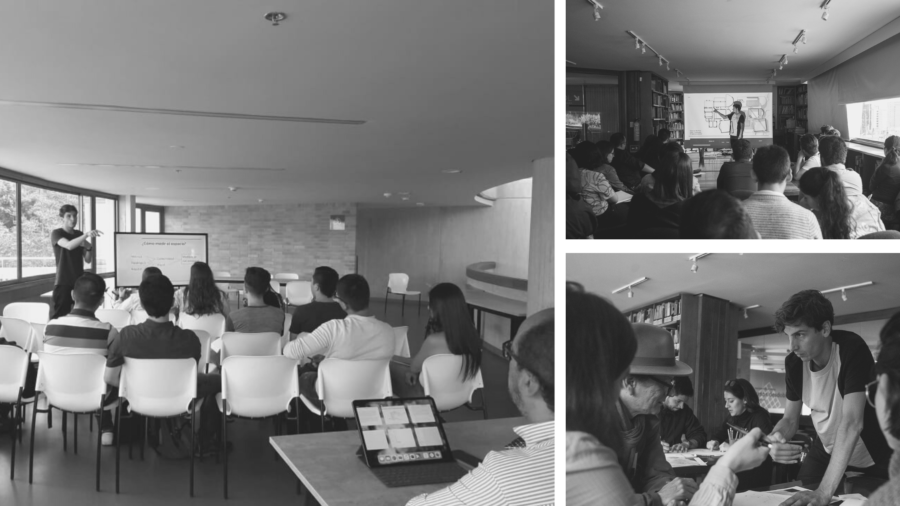
Figure 2: Greg leads a workshop. [Photo : Sebastian Bright & Luis Gonzáles]
The content
Given that this is not a tutorial, nor a paper for a journal, I will simply highlight some of the major points of what was actually covered in the workshops. First, I should mention that each of the three workshops (two in Bogotá -at Universidad de los Andes and MAMBO- and one in Manizales -Universidad de Caldas) were quite unique in setup and approach, but in all of them the core facilitating step was to introduce the Isovist app to teach some basic spatial analysis.
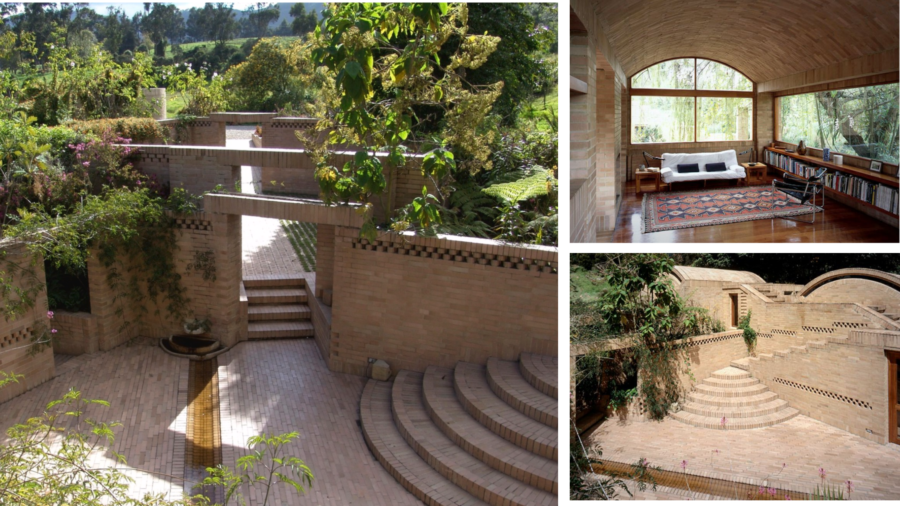
Figure 3: Casa en Rio Frío, R. Salmona, 2000. [Photos : Fundación Salmona]
All sessions started with an exercise to create justified graphs out of Salmona’s own country house ‘Casa en Rio Frío’ (see figure 3 above). This was a fun, hands-on exercise. Collectively, we calculated the mean depth of all the convex spaces (see figure 4 below). It seemed clear that we needed to integrate the exterior as part of the analysis and when looking at the shallowest places (commonly considered the ‘core’) of the building we agreed that it made sense for it to be outdoors. Most of Salmona’s principles of design incorporate the surroundings as key components of the built environment, so having ‘the outside’ as its core and more accessible place in the house was encompassing (yet, unorthodox for a house).
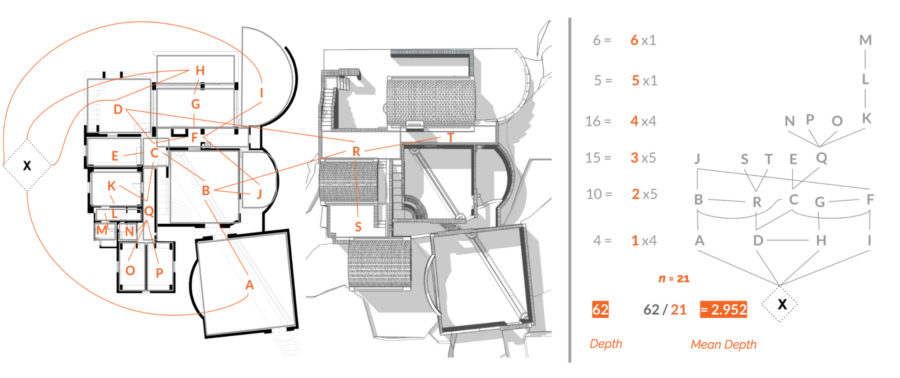
Figure 4: Convex areas definitions and justified graph from ‘the exterior’ of Casa en Rio Frío
Once this principle was understood, I moved into teaching a much more granular and detailed analysis, using the Isovist app. Here we analysed the visibility allowances on every little corner of space of the house (see figure 5 below). Our discussions started to explode at this point; and, as expected, we got several interpretations of the same outcomes. The more variations of the visual analysis that we explored together (like ‘compactness’), the more it became clear to our groups that Salmona had managed to formally redefine the limits of the built spaces beyond the previously defined convex spaces. Creating journeys with great levels of variations and experience was something that Salmona was well renowned for. Using the Isovist app we were able to develop an intuitive understanding of that but using novel analytical approaches!
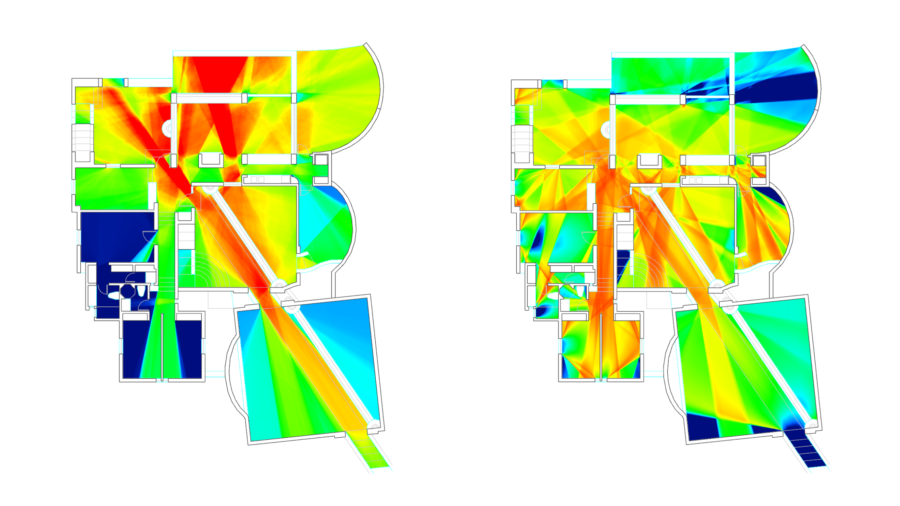
Figure 5: (left) Casa en Río Frio, Visibility analysis, mean visual depth; (right) compactness
It is worth mentioning that certain parts of the workshops did seem to be more revealing than others. What my training eyed seemed to find interesting, was sometimes too elaborate for there audience and not as captivating as some other more self-explanatory analysis. A good example was doing certain point depth analysis from key locations of the buildings (such as the outdoor plaza –‘core’- of the Cultural Centre Gabriel García Márquez – see figure 6 below). These barely need explanation but are helpful to demonstrate some fundamental principles of how one can measure space.
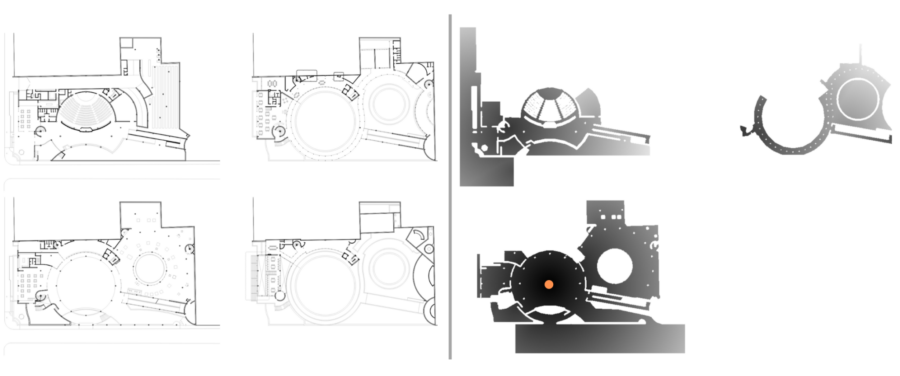
Figure 6: Metric point depth analysis from main plaza, considering only publicly accessible areas; Cultural Centre Gabriel García Márquez, Bogotá – Colombia, [R. Salmona, 2008]
As architects, we are usually trained to think about dimensions. As one develops more experience, intuitively we start to think about relations. Dimensions are rather simple to measure (providing you are familiar with the units of measure!), however, calculating topology is something we are less intuitively trained to do. When, on top of that, you add the possibility of analysing the angular relationship of such topology, you have abstracted the space into components that are hard to identify with the original space. However, all of those relations whether them being metric, topological, angular or otherwise, contain metadata about the space and precisely that is what I wanted my workshop participants to take with them.
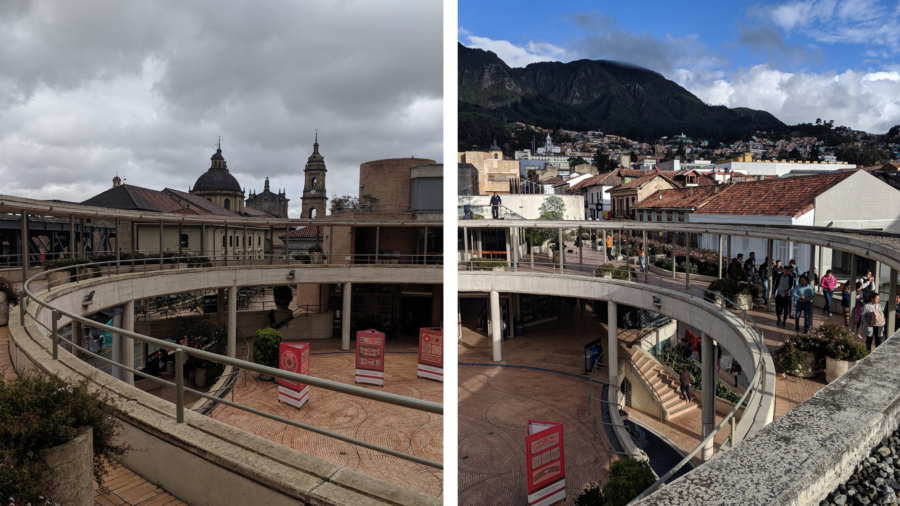

Figure 7: Cultural Centre Gabriel García Márquez, Bogotá – Colombia, R. Salmona, 2008
[Photos : Greg Maya]
A lot of participants in my workshops agreed that it was particularly important to combine all of the above to describe both the visual and the accessible fields – a task that I am still working on by creating multi-source data models that are starting to resemble more socio-econometric models than direct representations of space. Given that Salmona’s journeys through spaces tend to be highly curated and often ‘dislocated’ (a term used by one local professor describing the ‘willing for the eye to wander into places where the feet cannot follow’), it seemed like the conventional ways of measuring the buildings were not enough. So I developed a simple graph (see figure 8 below) to describe some of the possible ways of measuring spatial relations based on network theories and the possibilities offered by the Isovist app. It opens a whole new world of possibilities.
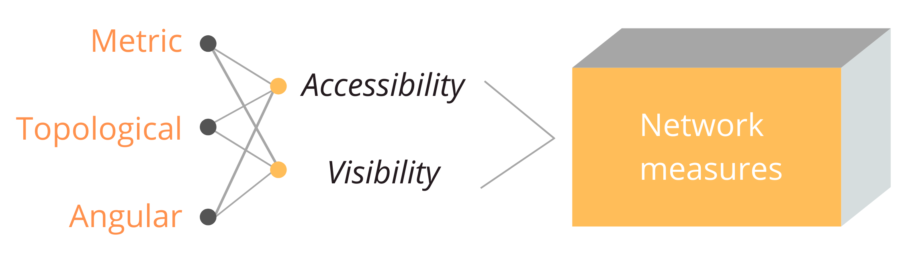
Figure 8: Combination of possibilities for ‘measuring the space’ using the Isovist app
As mentioned earlier, the purpose of the residency was not just to create workshop scenarios to ‘deliver’ some sort of ‘new knowledge’ but also, in my case, to reassess my personal practices and to reflect on how far I have gone into my journey of understanding how space shapes experience and collectively influence behaviour. Ever since I left Colombia in 2015, I have always been interested in keeping a close link with academia so that I could utilize that as a platform for sharing knowledge, research and experimentation. Clearly, these workshops were a small taste of that; in retrospect, there I things I have learnt from them that might now change my future proposals.
Potential improvements
Often the concepts of syntactic analysis are new for most workshop participants and take time to understand. In my first two workshops, I ended up rushing through some of the more in-depth content towards the end. Again, I was too ambitious! But I learnt and for the last workshop I decided not to attempt the on-site walk through with the group (even though we were at one of Salmona’s buildings – MAMBO). Instead we focused on reflecting what other analysis would be worth doing to this building to try to compare its evolution and changes over time (some of which I will discuss under next steps). That leads me to something else I wish we had had more time for: iterating over different stages of the same building (see figure 9). Spatial analysis often proves to be more interesting when compared across different stages of a building as opposed to simply doing comparatives within the same stage.
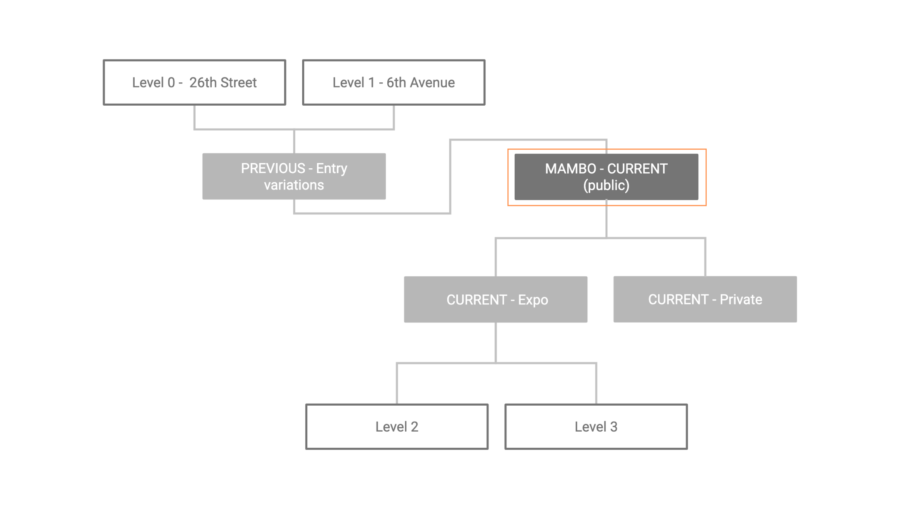
Figure 9: Possible iterations of analysis over the same building, Museum of Modern Art of Bogota (MAMBO), Bogotá – Colombia, R. Salmona, 1985
On the other hand, explaining some of this new content over non-conventional, boundaryless and compositionally-rich architecture was in itself a challenge. Ideally, you would want to start by creating a strong base of the methods analysing smaller and more traditional cases. Only then, would we have really been able to argue and demonstrate that, indeed, Salmona had (or had not) managed to translate into building shapes the ethical, political and even poetical aspirations that he was known for.
More often than not, I find myself entering into a problem that as analysts we are very prone to. The abundance of data can blur the notion of perspective and purpose. Knowing this, I was very careful not to overload the audience with several levels of detail with almost endless measures. Understanding how different levels of analysis could bring different levels of understanding is certainly one of the key factors that should not be overlooked or underestimated. So a lesson learnt from the first workshop that I took over to the following ones, was to take every single question and restructure it in a way that it was clear for the participants what were the key elements that could answer their question. With these ‘minimum common denominators’ you could then establish the level of detail needed and how to possibly go about creating an appropriate methodology that would help. Most certainly, I did not have the answers to all their questions but this was implementing a rational systematic technique to approach research that is rarely adopted in the design industry. Doing so is not really rocket science, just careful, meticulous and structured logic steps. If the audience understood the value of this, they could later apply it in their everyday projects; possibly the single most valuable outcome from the workshops. Sometimes the Isovist app provides a great medium to explore hidden properties and to generate very meaningful data but sometimes over information can be a double-edged sword. More often than not, whilst the methodologies are intuitive, our results are not. So dedicating time to structure our ideas before doing any ‘data crunching’ can really pay off.
Finally, I would have loved to have achieved some slightly more tangible outcomes! It seems like those could create, if nothing else, a reference of a memory that at the moment is with me and hopefully with some of the participants too. The idea of something that refreshes and challenges your mind now and then is probably desirable for learning too! Just like with the Isovist app (or any other skill) such repetition is certainly the key to mastering.
Next steps
Several months have gone by and multiple other projects have definitely happened in between, but part of my list of ‘unfinished projects’ either relate directly to this residency (and the workshops there) or have their origins here.
As mentioned, one very interesting route to take would be to explore the evolution of a building. A building like MAMBO has several iterations – from early compositional explorations to later adaptations during its lifespan. This is only one of multiple case studies that could well be scaled up to a bigger research project. The de Salmona Foundation (partners of the program) are keen on consolidating a breath of knowledge around his work and such a study could amplify their current breadth and depth.
Another exercise that should be added to this analysis is a detailed quantitative observation of flows and human responses to the buildings (snapshots). The lack of time and resources was restrictive on this aspect but I managed to have a go at an unconventional approach of automating people counting using machine learning algorithms for the Cultural Centre Gabriel García Márquez (figure 10, below). This is an approach that, if developed further, could become an invaluable resource for institutions that are willing to work towards creating flexible environments based on information.
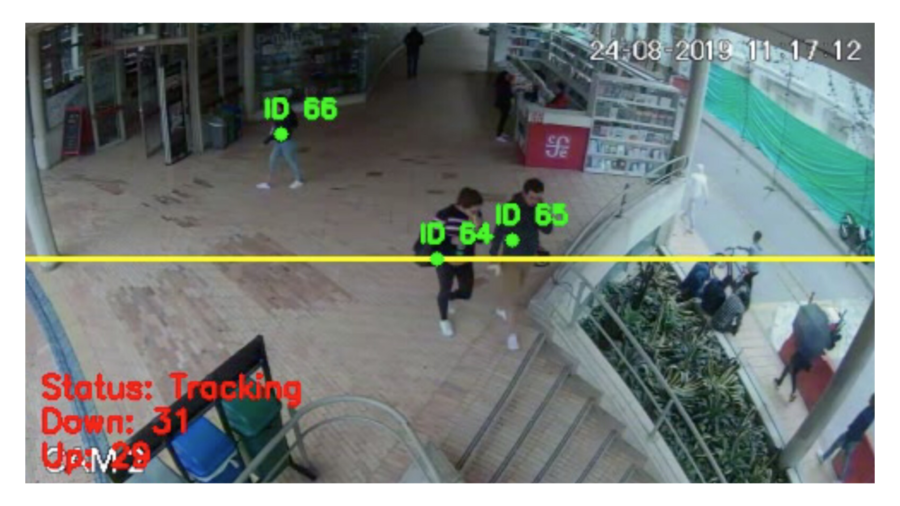
Figure 10: Counting algorithm test over CCTV camera videos, using Python + OpenCV, Cultural Centre Gabriel García Márquez, Bogotá
I will mention what I believe should be the evolution of this field onto two parallel paths. One one hand, creating a mass utilisation of quantitative tools like the Isovist app to everyday designers – hopefully with longer and structured syllabus than these workshops. And on the other hand, facilitating the overlap with other disciplines (such as computer sciences and statistics) to create valuable new findings from patterns we might not be trained to distinguish, yet. If you are interested, this is part of my personal research at the moment, so let’s talk. What we might be able to get to in the near future is a retrospective tool that explains how spatial features correlate with human behaviour.
In summary, this is an invitation to collaborate, to create scientific methods from conventional and unconventional sources. We need to allow for errors and chance encounters to teach us how right or wrong many of the design beliefs that we tend to have can be observed to be in built examples. Of course, I do encourage you to explore the work of Salmona and, if you can, to go and experience in real life what it feels like to walk and get lost in his maze-like, boundary-challenging buildings. Don’t stay shallow, dive deep!
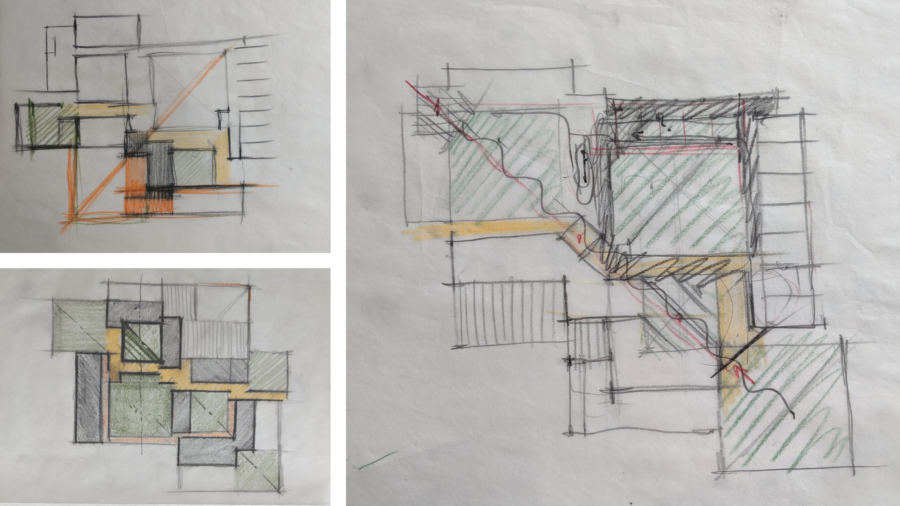
Figure 11: Early sketch of one of Salmona’s projects in the archive; clear intentions to wander in space before arriving at a destination. [Photos : Greg Maya]
One thought to “Exploring Salmona”
my e mail is anjaliasadanand@gmail.com can I correspond with you on isovists please.