The ‘Path Analysis’ menu allows for slightly more advanced analysis of isovist metrics along a user defined path. To do this:
- Import the drawing to be analysed, check that the drawing scale is set to an appropriate value, and check that the correct regions for analysis have been selected.
- Switch on the required isovist spatial types for analysis (i.e. Accessible, Visible, Reflected or Spectral) in the isovist analysis menu.
- Set any preferred isovist parameters (i.e. sweep, direction, or rims) in the isovist analysis menu.
- Open the ‘Path analysis menu’.
- Select the ‘Draw/edit path’ option, and click the cursor on the screen to set path nodes in a route across the drawing. Each cursor click will define a new path node.
- To relocate existing path nodes, hover the cursor over the node to be moved, and click drag the node to a new location.
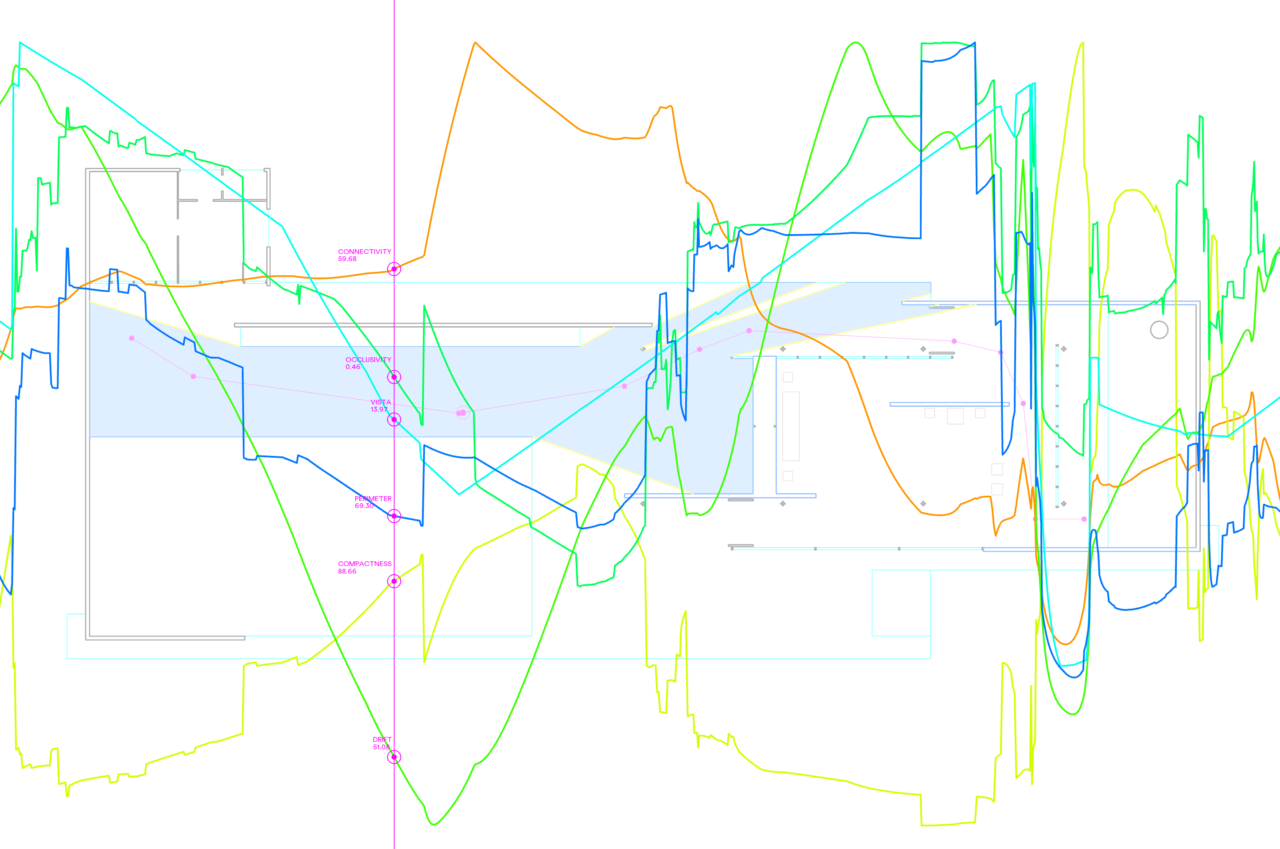
Above: Isovist path analysis of Mies’ Barcelona Pavilion
As each node is added or moved the path calculations will update in real-time accordingly. Each new path segment is rapidly subdivided and the isovist at every point along it is calculated instantaneously. A series of geometric values are extracted from each isovist and from said values a series of dynamically updating line-charts are drawn across the viewport. To review different values along the path length:
- Select and draw the required metric charts for interrogation using the ‘draw/hide charts’ option
- Switch the ‘chart annotations’ on using the respective toggle and move the cursor from left to right to vary the point of interrogation of the chart. An isovist will appear in the background drawing, along the length of the path to illustrate the respective location represented by the chart. Numeric values for that location will be annotated in magenta on the charts. Remember that the numeric values are dependent on the drawing unit scale previously set.
- To switch between distinct locational or accumulative values along the path charts, switch the ‘use accumulator charts’ option on or off.
All calculated path data can be exported as a csv file by selecting the export raw data option from the main menu whilst the path analysis is displayed on screen.
Below: A path analysis of Mies’ Barcelona Pavilion with charts revealed and labelled.