The mean depth and integration fields generated by the Isovist_App calculate on a continual temporal basis, beginning as broad estimates and iteratively converging upon an accurate result. The latter is stable in all plans by circa 250 global cycles. Underlying this convergence, every plan has a unique residual variation that is a product of the spatial morphology of that plan.
Below: ‘Spatial wobble’ plots for Mies’ Barcelona Pavilion.
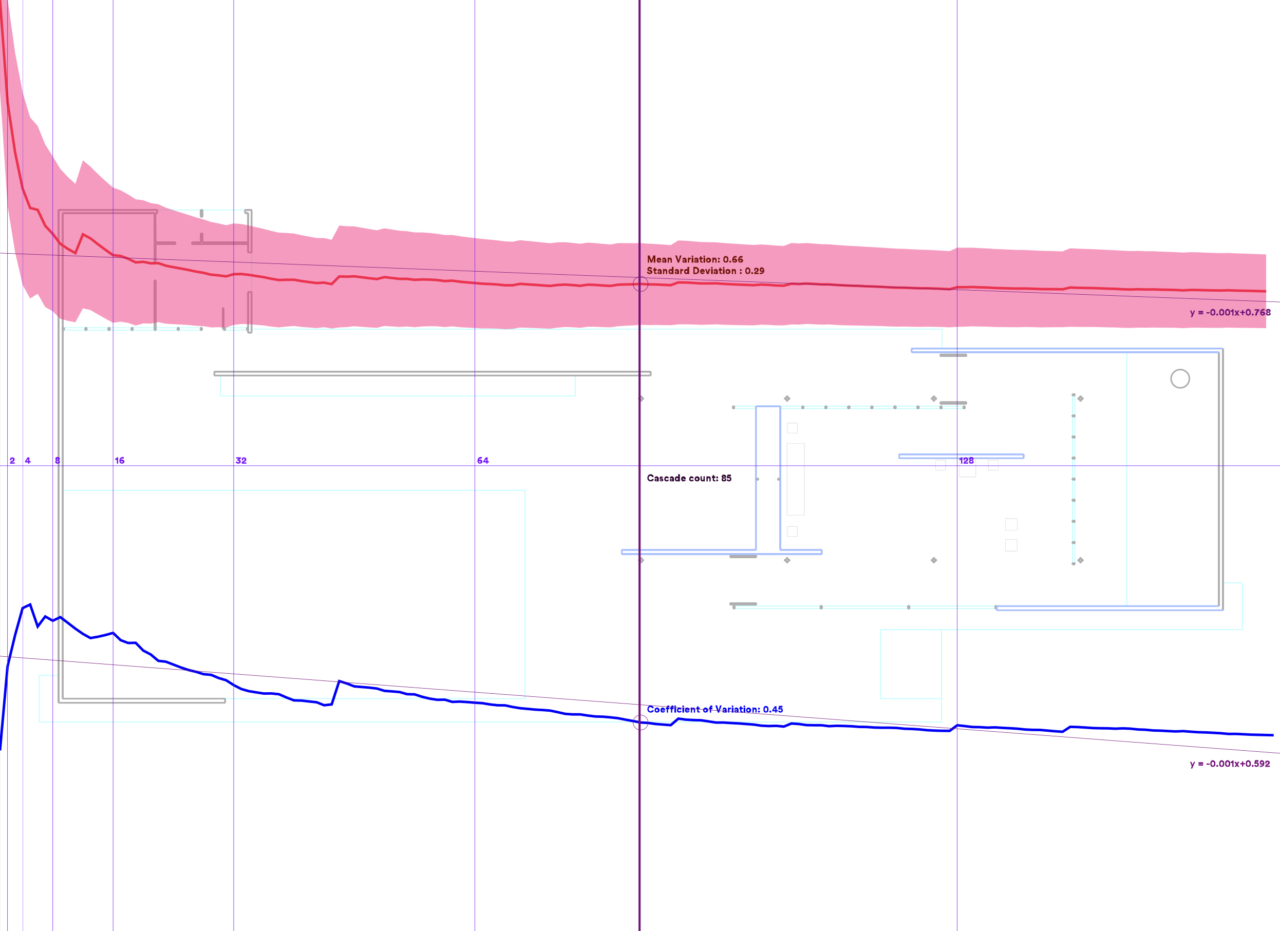
By measuring the mean residual variation across the whole of a plan we can identify characteristics that are related to qualities of complexity and entropy within the spatial configuration. The Isovist_app does this automatically, and displays the mean residual variation, the standard deviation of variation, and the coefficient of variation for each plan. These can be viewed in the main menu, in the ‘Spatial Wobble’ readout box.
The development of the above characteristics over time can also be viewed as a line chart. To review the latter:
- Import and set up a drawing for field analysis as normal.
- Open the ‘Field Analysis menu’, and run the analysis in the advanced mode.
- Watch the ‘Spatial wobble’ values in the main menu.
- When you wish to review the line chart of these values over time, select ‘show/hide wobble plots’ from the main menu viewport options. A pair of chart plots should appear on screen. Move the cursor over these to view values at any given point on the plots.
- To export the data of these plots, select ‘Import/Export’ from the primary menu at the top left of the screen, and then ‘Export data’. A file dialogue box should subsequently open to allow a file to be named and saved.
- On pressing ‘Ok’ in the file dialogue, the software will export a CSV data file with values for each iteration of the field variation over time.