The Isovist_App can also be used to generate a spatial co-visibility profile; a histogram that represents the likelihood of locations to either see one another or to share regions of co-visibility. This is unique for every building, but demonstrates some similarity between different building configurations. It takes the form of two sets of histogram bars for user defined sets of separation.
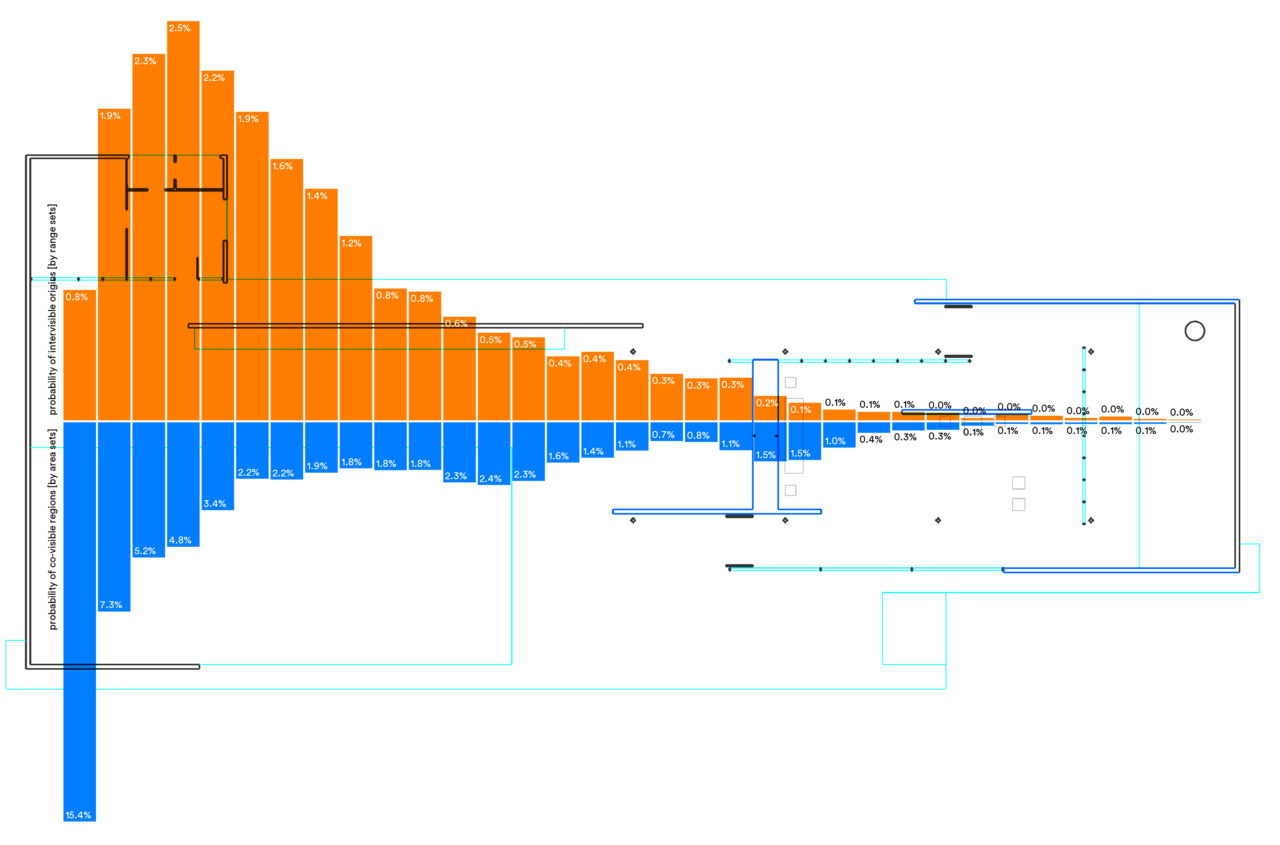
Above: The co-visibility profile histogram for Mies’ Barcelona Pavilion.
To generate an co-visibility profile:
- Set up a drawing and open the isovist analysis menu as normal.
- Select the ‘show/hide co-visibility histogram’ from the ‘toggle isovist overlays’ options. A set of orange and blue bars should appear on screen, annotated with percentage values. These will vary and settle over time.
- The orange bars illustrate the percentage of locations which are intervisible (i.e. can see one another), for each user defined range set. The blue bars represent the percentage of locations which have co-visible isovist regions (i.e. a degree of isovist overlap), for each user defined area set.
- To change the number of sets of range and area, drag the slider provided, and the histogram should recalculate immediately
Above: Generating a spatial co-visibility profile for Mies’ Barcelona Pavilion