The Isovist_App can be used to draw isovist justified graph diagrams to summarise the visual and spatial relations within a plan. These diagrams are very similar to basic space syntax justified graph diagrams, with the difference being the former’s linkages are based on isovist shape and inter-visibility rather than convex spaces.
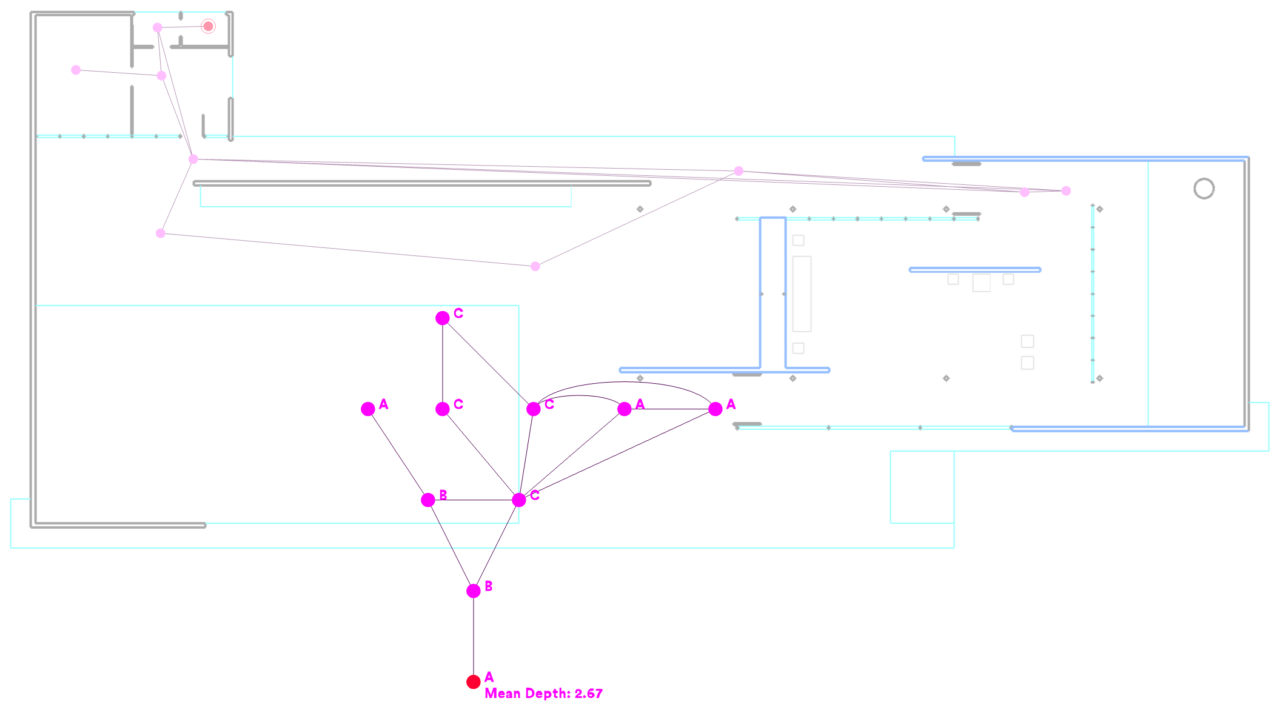
Above: A partial visual graph diagram in justified and true space form in Mies’ Barcelona Pavilion.
To draw an isovist justified graph:
- Set up a drawing and open the isovist analysis menu as normal.
- Open the ‘draw spatial graph’ sub menu and select ‘add/remove graph nodes’.
- Using the cursor, click at the desired ‘root’ location of the graph. Doing so adds a node, which just appear on screen in both localised and justified forms.
- Move the cursor and add more nodes as required. Each time nodes have a visual linkage, an edge will appear and the justified graph will grow. If an unconnected node is added, a new j-graph will be started.
- Hovering the cursor over a node and pressing delete will remove that node; clicking on a node will set that node as the root, and re-configure the j-graph accordingly.
- The j-graph will be labelled with node type, and the mean depth of the root node in each iteration.
- To collapse co-visible nodes (i.e. represent them with one single node, and simplify the j-graph accordingly) the ‘collapse co-visible nodes’ option can be toggled on and off.
- Exporting an image file whilst the isovist justified graph is viewable will produce an editable vector pdf.